

THE TOP ACADEMIC
OHIO HIGH SCHOOLS - 2014
NOVEMBER 14, 2014
PREPARED BY SCOTT GERBER
GERBER ANALYTICS, LLC
This document identifies the best schools in Ohio based on each school's performance on the Ohio Graduation Test (OGT). This is the only report that examines Ohio's public, private, and charter schools together. This specific report analyzes the March 2014 OGT, and this is the eighth year for this analysis.
What Was Included?
For those unfamiliar with the OGT tests, there are five subject tests -- Reading, Mathematics, Writing, Science, and Social Studies. There is also a summary page that shows the percentage of students who successfully passed all five subject tests with a “Proficient” rating. The data used in this report is from those five tests and the summary.
There were 1,008 schools included in this analysis. The Ohio Department of Education (ODE) Local Report Card data download capability was used to acquire most of the data for the public schools. The ODE provided electronic media as the source for the private school data, the charter schools, and the "percentage of students who passed all five parts" of the test for all schools.
Methodology Used
To obtain the initial group of schools to evaluate, the top schools were identified by using the percentage of students who scored “Proficient” on all five tests. This approach emphasizes the importance of getting all students to successfully pass the test. Those schools which had 91% of their 10th grade students pass all five portions of the test moved to the next round of the analysis. This year, 10.7% made the cut. Six schools had 100% passing rates for all five portions of the test.
YEAR |
# ACHIEVING 91% THRESHOLD |
% ACHIEVING 91% THRESHOLD |
# OF SCHOOLS WITH 100% PASS RATE |
| 2007 | 59 |
6.0% |
7 |
| 2008 | 65 |
6.6% |
12 |
| 2009 | 114 |
11.3% |
13 |
| 2010 | 63 |
6.2% |
5 |
| 2011 | 84 |
8.2% |
8 |
| 2012 | 104 |
10.1% |
9 |
| 2013 | 95 |
9.4% |
8 |
| 2014 | 108 |
10.7% |
6 |
After identifying the schools that met the 91% threshold, the next step was to calculate the "Performance Index Score (Adjusted)" (PIS) for each school. This field mimics the calculation that the Ohio Department of Education uses for its Performance Index Score, and it more accurately reflects the overall performance of a school. The difference between the ODE value and this document's is that this document calculates the number for only the 10th graders who took the tests. It also calculates the Performance Index Scores for private schools which the ODE does not provide. Creating this field permits an apples-to-apples comparison for all schools. Click here to go to the Appendix to view the calculation.
Championship Schools
My list of the championship schools is shown below in Performance Index Score order. St. Charles Preparatory, Seven Hills, and Ursuline Academy have been named as championship schools for each of the past eight years.
HIGH SCHOOL |
CITY |
COUNTY |
YEARS AS CHAMPION |
Columbus |
Franklin |
2007, 2008, 2009, 2010, 2011, 2012, 2013, 2014 |
|
Cincinnati |
Hamilton |
2011, 2012, 2013, 2014 |
|
Cincinnati |
Hamilton |
2007, 2008, 2009, 2010, 2011, 2012, 2013, 2014 |
|
Cincinnati |
Hamilton |
2007, 2008, 2009, 2010, 2011, 2012, 2013, 2014 |
|
| Cleveland | Cuyahoga | 2007, 2008, 2009, 2010, 2011, 2012, 2014 |
|
Columbus |
Franklin |
2007, 2008, 2010, 2011, 2012, 2013, 2014 |
|
Columbus |
Franklin |
2008, 2011, 2014 |
Identifying the Championship Schools
The criteria for selecting the championship schools should be relatively clear upon examination of the table below. The schools were selected based on a combination of Performance Index Scores, the number of top ten rankings in each subject, and a natural break between schools. The seven schools identified as champion schools had Performance Index Scores that were slightly higher than last year's championship schools.
This is the second year that statewide rankings are displayed for each school. To create the rankings, the Performance Index Scores were calculated for each individual subject. The schools' subject Performance Index Scores were then sorted. For example, St. Charles had the highest ranking with its overall Performance Index Score (116.4) , and when the same calculation was used to create a "Performance Index Score" for the individual subjects, it was also ranked first in Mathematics, Reading, Science, and Social Studies. The schools which have subjects ranked in the state's top ten are further identified with a blue background.
The subject rankings provide an additional dimension by helping to identify the strengths and weaknesses within each school. To view detailed performance on each school, click on the school name. (See below for more information about the rankings.)
Note that the table is long -- it contains detailed data for all of the 108 schools that reached the 91% threshold. These schools are sorted according to their Performance Index Scores.
| HIGH SCHOOL / DISTRICT |
# STU. |
PASS 5% |
STATEWIDE RANKINGS |
# TOP 10 |
||||||
READING |
MATH |
WRITING |
SCIENCE |
SOCIAL STUDIES |
||||||
| St Charles Preparatory HS Columbus Diocese |
Franklin | 150 |
116.5 |
100%
|
1
|
1
|
8
|
1
|
1
|
5 |
| Walnut Hills High School Cincinnati City |
Hamilton | 389 |
115.4 |
99.2%
|
5
|
3
|
15
|
8
|
2
|
4 |
| Ursuline Academy HS Cincinnati Archdiocese |
Hamilton | 171 |
115.2 |
98.8%
|
2
|
7
|
3
|
2
|
20
|
4 |
| Seven Hills School OAIS - Seven Hills School |
Hamilton | 83 |
114.7 |
98.8%
|
7
|
25
|
22
|
3
|
6
|
3 |
| Hathaway Brown HS OAIS - Hathaway Brown |
Cuyahoga | 86 |
114.7 |
100%
|
6
|
8
|
2
|
15
|
5
|
4 |
| Columbus School for Girls OAIS - Columbus School For Girls |
Franklin | 54 |
114.6 |
98.1%
|
4
|
5
|
29
|
6
|
13
|
3 |
| Columbus Academy OAIS - Columbus Academy |
Franklin | 90 |
114.5 |
97.8%
|
3
|
18
|
7
|
10
|
19
|
3 |
| Ottawa Hills High School Ottawa Hills Local |
Lucas | 77 |
114.4 |
97.4%
|
10
|
15
|
11
|
9
|
11
|
2 |
| Summit Country Day HS OAIS - Summit Country Day |
Hamilton | 84 |
114.2 |
97.6%
|
9
|
11
|
1
|
18
|
27
|
2 |
| Dublin Jerome High School Dublin City |
Franklin | 368 |
114.1 |
96.7%
|
19
|
17
|
32
|
5
|
7
|
2 |
| Laurel School Academy OAIS - Laurel |
Cuyahoga | 64 |
114.1 |
100%
|
8
|
31
|
6
|
32
|
4
|
3 |
| Hawken School OAIS - Hawken School |
Geauga | 104 |
113.7 |
100%
|
11
|
14
|
20
|
11
|
44
|
0 |
| Toledo Early College High School Toledo City |
Lucas | 36 |
113.7 |
97.2%
|
13
|
6
|
42
|
42
|
8
|
2 |
| Chagrin Falls High School Chagrin Falls Exempted Village |
Cuyahoga | 165 |
113.6 |
97.6%
|
15
|
12
|
25
|
14
|
25
|
0 |
| HIGH SCHOOL / DISTRICT |
# STU. |
PASS 5% |
STATEWIDE RANKINGS |
# TOP 10 |
||||||
READING |
MATH |
WRITING |
SCIENCE |
SOCIAL STUDIES |
||||||
| John Hay Early College High School Cleveland Municipal SD |
Cuyahoga | 76 |
113.6 |
98.7%
|
17
|
2
|
23
|
65
|
12
|
1 |
| Madeira High School Madeira City |
Hamilton | 111 |
113.5 |
94.6%
|
22
|
22
|
30
|
22
|
16
|
0 |
| Oakwood High School Oakwood City |
Montgomery | 170 |
113.4 |
95.9%
|
21
|
24
|
12
|
16
|
31
|
0 |
| Upper Arlington High School Upper Arlington City |
Franklin | 439 |
113.3 |
94.8%
|
29
|
16
|
60
|
33
|
9
|
1 |
| Solon High School Solon City |
Cuyahoga | 450 |
113.2 |
94.4%
|
18
|
27
|
87
|
16
|
15
|
0 |
| Montessori HS at University Circle Montessori HS |
Cuyahoga | 34 |
113.2 |
100%
|
12
|
74
|
5
|
26
|
21
|
1 |
| Hudson High School Hudson City |
Summit | 395 |
113.1 |
95.2%
|
23
|
39
|
26
|
30
|
17
|
0 |
| Akron Early College High School Akron City |
Summit | 80 |
113.1 |
95.0%
|
46
|
19
|
16
|
69
|
3
|
1 |
| Bishop Rosecrans HS Columbus Diocese |
Muskingum | 30 |
112.9 |
96.7%
|
41
|
23
|
34
|
4
|
75
|
1 |
| Old Fort High School Old Fort Local |
Sandusky | 22 |
112.8 |
90.9%
|
24
|
47
|
14
|
61
|
14
|
0 |
| Cincinnati Country Day HS OAIS - Cincinnati Country Day |
Hamilton | 67 |
112.8 |
98.5%
|
16
|
40
|
39
|
26
|
32
|
0 |
| Minster High School Minster Local |
Auglaize | 65 |
112.7 |
95.4%
|
39
|
29
|
96
|
13
|
29
|
0 |
| St Xavier HS Cincinnati Archdiocese |
Hamilton | 403 |
112.7 |
97.0%
|
25
|
34
|
65
|
20
|
45
|
0 |
| Bishop Watterson HS Columbus Diocese |
Franklin | 226 |
112.6 |
97.3%
|
36
|
82
|
13
|
34
|
18
|
0 |
| Wyoming High School Wyoming City |
Hamilton | 167 |
112.6 |
97.0%
|
33
|
26
|
45
|
41
|
30
|
0 |
| HIGH SCHOOL / DISTRICT |
# STU. |
PASS 5% |
STATEWIDE RANKINGS |
# TOP 10 |
||||||
READING |
MATH |
WRITING |
SCIENCE |
SOCIAL STUDIES |
||||||
| Lake Ridge Academy OAIS - Lake Ridge Academy |
Lorain | 42 |
112.4 |
95.2%
|
31
|
52
|
88
|
25
|
22
|
0 |
| Magnificat HS Cleveland Catholic Diocese |
Cuyahoga | 187 |
112.3 |
97.3%
|
14
|
92
|
27
|
37
|
55
|
0 |
| Dublin Coffman High School Dublin City |
Franklin | 491 |
112.3 |
94.9%
|
43
|
30
|
93
|
36
|
28
|
0 |
| Rocky River High School Rocky River City |
Cuyahoga | 205 |
112.3 |
94.1%
|
53
|
32
|
34
|
39
|
54
|
0 |
| Aurora High School Aurora City |
Portage | 250 |
112.1 |
95.2%
|
50
|
36
|
77
|
40
|
47
|
0 |
| Miami Valley School OAIS - Miami Valley |
Montgomery | 39 |
112.1 |
97.4%
|
54
|
10
|
100
|
21
|
86
|
1 |
| Bellbrook High School Sugarcreek Local School District |
Greene | 213 |
112.1 |
95.3%
|
67
|
57
|
59
|
24
|
23
|
0 |
| William Mason High School Mason City |
Warren | 860 |
112.0 |
92.1%
|
60
|
32
|
85
|
50
|
24
|
0 |
| Miller City High School Miller City-New Cleveland Local |
Putnam | 34 |
112.0 |
97.1%
|
59
|
9
|
129
|
53
|
35
|
1 |
| Indian Hill High School Indian Hill Exempted Village |
Hamilton | 151 |
112.0 |
92.7%
|
38
|
37
|
66
|
44
|
56
|
0 |
| Cincinnati Hills Christian Academy OAIS - Cincinnati Hills Christian Academy |
Hamilton | 124 |
112.0 |
96.0%
|
72
|
21
|
91
|
29
|
57
|
0 |
| Beaumont School Cleveland Catholic Diocese |
Cuyahoga | 81 |
112.0 |
96.3%
|
20
|
103
|
4
|
71
|
34
|
1 |
| Russia High School Russia Local |
Shelby | 44 |
111.9 |
93.2%
|
70
|
4
|
167
|
47
|
41
|
1 |
| Mariemont High School Mariemont City |
Hamilton | 126 |
111.9 |
93.7%
|
32
|
62
|
33
|
69
|
33
|
0 |
| Olentangy High School Olentangy Local |
Delaware | 380 |
111.8 |
92.1%
|
65
|
65
|
73
|
38
|
26
|
0 |
| HIGH SCHOOL / DISTRICT |
# STU. |
PASS 5% |
STATEWIDE RANKINGS |
# TOP 10 |
||||||
READING |
MATH |
WRITING |
SCIENCE |
SOCIAL STUDIES |
||||||
| Sycamore High School Sycamore Community City |
Hamilton | 395 |
111.8 |
93.9%
|
49
|
42
|
111
|
43
|
38
|
0 |
| Delaware Christian HS Delaware Christian |
Delaware | 26 |
111.7 |
100%
|
30
|
71
|
9
|
51
|
115
|
1 |
| Botkins High School Botkins Local |
Shelby | 45 |
111.7 |
93.3%
|
52
|
45
|
17
|
99
|
43
|
0 |
| Olentangy Liberty High School Olentangy Local |
Delaware | 468 |
111.6 |
95.1%
|
66
|
67
|
57
|
35
|
60
|
0 |
| Dayton Regional STEM School |
65 |
111.4 |
92.3%
|
75
|
50
|
80
|
12
|
105
|
0 |
|
| Kalida High School Kalida Local |
Putnam | 56 |
111.3 |
96.4%
|
88
|
38
|
101
|
59
|
50
|
0 |
| Independence High School Independence Local |
Cuyahoga | 77 |
111.3 |
92.2%
|
60
|
105
|
37
|
52
|
58
|
0 |
| Turpin High School Forest Hills Local |
Hamilton | 298 |
111.3 |
94.0%
|
84
|
66
|
56
|
53
|
49
|
0 |
| New Albany High School New Albany-Plain Local |
Franklin | 314 |
111.3 |
92.7%
|
44
|
53
|
68
|
60
|
70
|
0 |
| St Ursula Academy Cincinnati Archdiocese |
Hamilton | 172 |
111.2 |
94.2%
|
26
|
86
|
19
|
81
|
103
|
0 |
| Brecksville-Broadview Heights High Schoo Brecksville-Broadview Heights City |
Cuyahoga | 357 |
111.2 |
92.4%
|
86
|
60
|
55
|
56
|
63
|
0 |
| Notre Dame Academy Toledo Diocese |
Lucas | 141 |
111.2 |
95.7%
|
28
|
77
|
10
|
94
|
116
|
1 |
| Western Reserve Academy OAIS - Western Reserve Academy |
Summit | 90 |
111.1 |
93.3%
|
74
|
20
|
78
|
46
|
171
|
0 |
| Maumee Valley Country Day HS OAIS - Maumee Valley Country Day |
Lucas | 47 |
111.0 |
91.5%
|
73
|
13
|
43
|
87
|
144
|
0 |
| Village Academy OAIS - Learning Unlimited-Village Academy |
Delaware | 36 |
110.9 |
94.4%
|
35
|
48
|
82
|
121
|
71
|
0 |
| HIGH SCHOOL / DISTRICT |
# STU. |
PASS 5% |
STATEWIDE RANKINGS |
# TOP 10 |
||||||
READING |
MATH |
WRITING |
SCIENCE |
SOCIAL STUDIES |
||||||
| St Ignatius HS Cleveland Catholic Diocese |
Cuyahoga | 371 |
110.8 |
92.2%
|
58
|
69
|
69
|
103
|
62
|
0 |
| Wellington School OAIS - Wellington School |
Franklin | 46 |
110.8 |
93.5%
|
62
|
56
|
44
|
88
|
97
|
0 |
| Kenston High School Kenston Local |
Geauga | 254 |
110.8 |
94.1%
|
81
|
59
|
95
|
63
|
74
|
0 |
| Kirtland High School Kirtland Local |
Lake | 85 |
110.7 |
90.6%
|
42
|
68
|
89
|
109
|
81
|
0 |
| Walsh Jesuit HS Cleveland Catholic Diocese |
Summit | 261 |
110.7 |
93.9%
|
69
|
123
|
114
|
31
|
79
|
0 |
| Bishop Hartley HS Columbus Diocese |
Franklin | 181 |
110.4 |
91.2%
|
47
|
157
|
58
|
74
|
83
|
0 |
| Canfield High School Canfield Local |
Mahoning | 208 |
110.4 |
92.3%
|
108
|
72
|
131
|
67
|
59
|
0 |
| Centerville High School Centerville City |
Montgomery | 695 |
110.4 |
90.6%
|
87
|
88
|
120
|
62
|
68
|
0 |
| Versailles High School Versailles Exempted Village |
Darke | 103 |
110.3 |
93.2%
|
149
|
35
|
63
|
95
|
105
|
0 |
| Archbishop Alter HS Cincinnati Archdiocese |
Montgomery | 168 |
110.3 |
91.7%
|
68
|
158
|
36
|
126
|
48
|
0 |
| Lowellville High School Lowellville Local |
Mahoning | 52 |
110.2 |
96.2%
|
63
|
76
|
90
|
104
|
96
|
0 |
| Mount Notre Dame HS Cincinnati Archdiocese |
Hamilton | 190 |
110.2 |
91.1%
|
37
|
224
|
31
|
78
|
107
|
0 |
| St Edward HS Cleveland Catholic Diocese |
Cuyahoga | 240 |
110.1 |
92.9%
|
102
|
78
|
103
|
48
|
150
|
0 |
| Granville High School Granville Exempted Village |
Licking | 210 |
110.1 |
93.3%
|
77
|
64
|
133
|
86
|
120
|
0 |
| Mosdos Ohr Hatorah HS |
Cuyahoga | 15 |
110.1 |
93.3%
|
56
|
113
|
184
|
105
|
53
|
0 |
| HIGH SCHOOL / DISTRICT |
# STU. |
PASS 5% |
STATEWIDE RANKINGS |
# TOP 10 |
||||||
READING |
MATH |
WRITING |
SCIENCE |
SOCIAL STUDIES |
||||||
| St John's Jesuit HS Toledo Diocese |
Lucas | 92 |
109.9 |
92.4%
|
114
|
100
|
212
|
49
|
80
|
0 |
| Archbishop Hoban HS Cleveland Catholic Diocese |
Summit | 211 |
109.9 |
91.5%
|
55
|
153
|
50
|
66
|
189
|
0 |
| Grandview Heights High School Grandview Heights City |
Franklin | 75 |
109.9 |
90.7%
|
153
|
101
|
119
|
55
|
102
|
0 |
| St Ursula Academy Toledo Diocese |
Lucas | 133 |
109.9 |
91.0%
|
96
|
145
|
41
|
133
|
66
|
0 |
| Pettisville High School Pettisville Local |
Fulton | 44 |
109.8 |
93.2%
|
163
|
51
|
74
|
45
|
244
|
0 |
| Avon Lake High School Avon Lake City |
Lorain | 271 |
109.6 |
90.8%
|
115
|
79
|
136
|
67
|
142
|
0 |
| West Geauga High School West Geauga Local |
Geauga | 196 |
109.6 |
90.8%
|
113
|
118
|
162
|
80
|
81
|
0 |
| John Hay School of Science & Medicine Cleveland Municipal SD |
Cuyahoga | 88 |
109.6 |
97.7%
|
157
|
63
|
138
|
166
|
52
|
0 |
| Olmsted Falls High School Olmsted Falls City |
Cuyahoga | 288 |
109.5 |
90.6%
|
102
|
87
|
121
|
122
|
118
|
0 |
| Notre Dame-Cathedral Latin HS Cleveland Catholic Diocese |
Geauga | 186 |
109.5 |
92.5%
|
48
|
110
|
81
|
137
|
187
|
0 |
| Lutheran West HS Cleveland Lutheran Hs Assoc |
Cuyahoga | 109 |
109.3 |
92.7%
|
101
|
210
|
72
|
98
|
94
|
0 |
| St Joseph Academy Cleveland Catholic Diocese |
Cuyahoga | 168 |
109.3 |
90.5%
|
45
|
201
|
86
|
131
|
145
|
0 |
| Bishop Fenwick HS Cincinnati Archdiocese |
Warren | 140 |
109.2 |
95.0%
|
158
|
106
|
125
|
57
|
169
|
0 |
| Moeller HS Cincinnati Archdiocese |
Hamilton | 232 |
109.2 |
90.5%
|
141
|
146
|
130
|
106
|
71
|
0 |
| Cuyahoga Valley Christian Academy Cuyahoga Valley Christian Acad |
Summit | 146 |
109.2 |
92.5%
|
90
|
136
|
99
|
140
|
126
|
0 |
| HIGH SCHOOL / DISTRICT |
# STU. |
PASS 5% |
STATEWIDE RANKINGS |
# TOP 10 |
||||||
READING |
MATH |
WRITING |
SCIENCE |
SOCIAL STUDIES |
||||||
| Bluffton High School Bluffton Exempted Village |
Allen | 81 |
109.1 |
91.4%
|
145
|
168
|
132
|
73
|
110
|
0 |
| Maplewood High School Maplewood Local |
Trumbull | 64 |
109.1 |
90.6%
|
155
|
93
|
118
|
148
|
108
|
0 |
| Madison Christian School Franklin |
Franklin | 45 |
109.0 |
93.3%
|
169
|
237
|
70
|
158
|
37
|
0 |
| Dalton High School Dalton Local |
Wayne | 76 |
109.0 |
92.1%
|
148
|
121
|
53
|
85
|
221
|
0 |
| Andrews Osborne Academy |
Lake | 38 |
109.0 |
92.1%
|
201
|
28
|
250
|
117
|
158
|
0 |
| Perrysburg High School Perrysburg Exempted Village |
Wood | 346 |
108.9 |
92.5%
|
120
|
120
|
124
|
123
|
151
|
0 |
| St Francis De Sales HS Columbus Diocese |
Franklin | 218 |
108.6 |
91.3%
|
162
|
154
|
61
|
118
|
202
|
0 |
| Crestview High School Crestview Local |
Van Wert | 59 |
108.3 |
93.2%
|
214
|
91
|
272
|
153
|
111
|
0 |
| Vanlue High School Vanlue Local |
Hancock | 19 |
108.3 |
94.7%
|
160
|
139
|
97
|
169
|
181
|
0 |
| Poland Seminary High School Poland Local |
Mahoning | 183 |
108.3 |
91.8%
|
107
|
104
|
243
|
163
|
196
|
0 |
| Tree of Life-Northridge Branch Tree of Life |
Franklin | 44 |
108.1 |
90.9%
|
161
|
241
|
92
|
97
|
212
|
0 |
| Ottoville High School Ottoville Local |
Putnam | 24 |
108.0 |
95.8%
|
192
|
148
|
235
|
125
|
176
|
0 |
| Eastwood I High School Eastwood Local |
Wood | 112 |
107.8 |
91.1%
|
138
|
275
|
139
|
129
|
190
|
0 |
| Fort Loramie Junior-Senior High School Fort Loramie Local |
Shelby | 80 |
107.7 |
91.3%
|
333
|
111
|
415
|
79
|
133
|
0 |
| Bloomfield High School Bloomfield-Mespo Local |
Trumbull | 14 |
107.7 |
92.9%
|
261
|
43
|
258
|
202
|
229
|
0 |
| HIGH SCHOOL / DISTRICT |
# STU. |
PASS 5% |
STATEWIDE RANKINGS |
# TOP 10 |
||||||
READING |
MATH |
WRITING |
SCIENCE |
SOCIAL STUDIES |
||||||
| Xenia Christian HS Xenia Christian |
Greene | 32 |
107.5 |
90.6%
|
131
|
252
|
165
|
92
|
328
|
0 |
| New Knoxville High School New Knoxville Local |
Auglaize | 31 |
106.8 |
93.5%
|
212
|
286
|
330
|
157
|
175
|
0 |
| New London High School New London Local |
Huron | 75 |
106.6 |
93.3%
|
340
|
256
|
177
|
205
|
179
|
0 |
| Franklin Monroe High School Franklin Monroe Local |
Darke | 67 |
106.0 |
91.0%
|
288
|
230
|
408
|
204
|
237
|
0 |
Using This List
The schools on My Top Academic Ohio High School list are all exceptional schools; however, there are other excellent schools which are not on the list because they did not reach the 91% "Passed Five of Five" threshold. If a school wants to proclaim that it is 25th on the list, that is appropriate. To proclaim that a school is 25th in academics in Ohio, is inappropriate. Again, the 91% threshold is extremely important because it tells readers that essentially all of the students are extremely serious about academics and that all of the kids in each and every classroom really care. There are also a few schools that have been on the list in the past (i.e. Gilmour Academy and University School) but not this year because not all of their performance data was included. The ODE also requires that at least ten students take the tests before they release the data and some schools did not have enough students take the test. For the complete ranking list of all schools in Ohio, click here.
Comparative Analysis
While the performance numbers and trend charts are beneficial, what sets this web site apart from others is the comparative analysis that this site permits with other schools and within schools.
An example of a side-by-side comparison is here with Worthington Kilbourne and Thomas Worthington. As with most schools within the same school system, the results are similar.
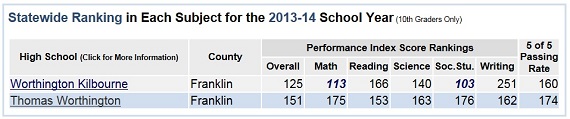 Looking at a comparison within a school, Worthington Kilbourne excels in Mathematics, and Social Studies. Thomas Worthington is stronger in Reading.
One of the goals for this web site is to encourage communities to become better informed and to ask questions. These tools encourage this.
Additional Graphs Provide a New Perspective
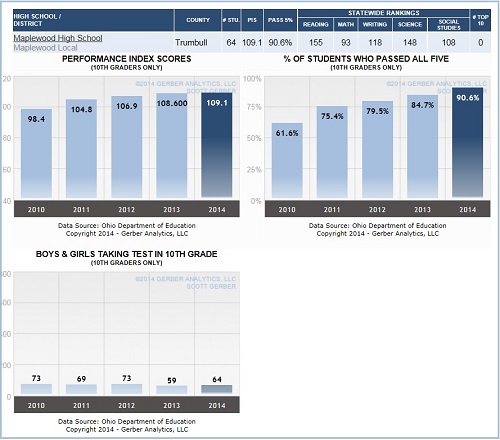
Viewing five year trend charts is the best way to evaluate schools because it makes it possible to see which schools are already outstanding and which schools are very good and trending higher (i.e. Maplewood, St. Francis DeSales, Wyoming, Dublin Coffman, Sycamore, Toledo Notre Dame Academy, Walsh Jesuit, and Canfield). This year, five year trend charts are provided within this document for the Performance Index Scores, % Students Who Passed All Five Tests, and the Number of Students Who Took the Test each year. Normally, this amount of information has not been shared in this document series, but an exception was made this year. By adding these graphs, this likely makes this report the most valuable and succinct document to compare Ohio's best schools.
 Click on the following link to view the graphs for all of these schools. Click on the next link to return to normal viewing.
Note that these graphs only reflect those students who took the test as 10th graders.
As you review the fluctuations in the number of students who take the test each year, keep in mind what you have read in Malcolm Gladwell's book, David and Goliath, about class sizes.
To Repeat a Portion of Last Year's Report. . .
Does this document include any mistakes? Hopefully not, the data was carefully entered and the numbers were double checked, but it is possible. Please send a Feedback message with any significant discrepancies. The revised document will be updated and placed online.
Will this type of ranking put more pressure on schools to do well? It might if the State of Ohio would endorse and publish the results of this type of friendly competition. It would encourage all schools and their students to do better as they strive to be one of the best schools. However, this is not about applying pressure to just the high schools. Excellent performance on this 10th grade test is not possible without the following:
- Hard-working students who are willing to spend multiple hours on homework every night and who are challenging and competing against their fellow classmates. (And remember, unlike sporting events, every student in the 10th grade participates and every student matters.)
- Caring parents who are giving their children an opportunity to work on their assignments and making the sacrifices to help their children by transporting them to better schools outside of their neighborhood; by paying tuition or higher property taxes (or both) to allow their children to go to a better school; and/or by moving to a community that places a greater emphasis on education
- Outstanding teachers who teach well and who can motivate their students
- Administrations who set high expectations for the students, teachers, and parents
- Outstanding elementary and middle school teachers who have established a solid foundation for the students
- Active volunteers who help with those activities that the teacher / administrative staff do not have the expertise and/or time to perform
- Supporting communities that place a high value on education and by ensuring that there is a tradition of academic excellence
Will this type of ranking force schools to spend more time emphasizing the process of test taking? Some schools spend an inordinate amount of time teaching their students to take the OGT. The above schools also prepare for the OGT, but they likely cover the fundamentals so thoroughly that the OGT is a minor distraction for them -- not a major emphasis. There are also some schools that appear to have substantially better approaches than others to teach some subjects. Perhaps they would be willing to share some of their best practices with other schools?
While it would certainly be great to profit from this effort, please record the last eight years of this education analysis as a pro-bono or volunteer effort. I do this type of analysis because I enjoy doing it. I am also hopeful that it will benefit an extremely large number of Ohioans. If this analysis receives a large distribution, that might happen.
You may forward this report to anyone you wish but please give proper attribution if you use any of this material. To assist with tracking, please provide others with this link:
I have a substantial "one-of-a-kind" database, and I am open to new analysis projects. If you have an education-related analysis project in mind that you think would benefit all Ohio schools, please contact me.
Please let me know if you have any questions or comments.
Scott Gerber
Gerber Analytics, LLC
GerberAnalytics.com
Click to submit a Feedback for any questions and/or to have your email address included so that you may be alerted to additional analysis.
Calculation of Performance Index Score (Adjusted)
Note that the Performance Index Score (Adjusted) is different from what you may have seen on the Ohio Department of Education’s Report Card. The calculation in this document is only for the 10th grade students. It was calculated as follows:
Ada High School
Subject |
Below Basic | Basic | Proficient | Accelerated | Advanced |
|
| Mathematics | 9.4% | 9.4% | 24.5% | 20.8% | 35.8% | |
| Reading | 3.8% | 5.7% | 43.4% | 35.8% | 11.3% | |
| Science | 3.8% | 18.9% | 26.4% | 22.6% | 28.3% | |
| Social Studies | 15.1% | 9.4% | 24.5% | 22.6% | 28.3% | |
| Writing | 5.7% | 5.7% | 39.6% | 47.2% | 1.9% | |
| Total of Above | 37.7% | 49.1% | 158.5% | 149.1% | 105.7% | |
| Average of 5 | 7.5% | 9.8% | 31.7% | 29.8% | 21.1% | |
| Factor | 0.3 | 0.6 | 1 | 1.1 | 1.2 | |
| Summation | ||||||
| Average * Factor | 2.3 | 5.9 | 31.7 | 32.8 | 25.4 | 98 |
The new "Advanced Plus" designation was used randomly for some schools. To insure an "apples-to-apples" comparison, the percentage of students scoring "Advanced Plus" was added to the Advance category.