

THE TOP ACADEMIC
OHIO HIGH SCHOOLS - 2013
NOVEMBER 6, 2013
AMENDED: NOVEMBER 21, 2014
PREPARED BY SCOTT GERBER
GERBER ANALYTICS, LLC
This document identifies the best schools in Ohio based on each school's performance on the Ohio Graduation Test (OGT). This is the only report that examines Ohio's public, private, and charter schools together. This report analyzes the March 2013 OGT, and this is the seventh year for this analysis.
What Was Included?
For those unfamiliar with the OGT tests, there are five parts -- Reading, Mathematics, Writing, Science, and Social Studies. There is also a summary page that shows the percentage of students who successfully passed all five parts with a “Proficient” rating. The data used in this report is from those five parts and the summary.
There were 1,006 schools included in this analysis. The Ohio Department of Education (ODE) Local Report Card data download capability was used to acquire most of the data for the public schools. The ODE provided electronic media as the source for the private school data, the charter schools, and the "percentage of students who passed all five parts" of the test for all schools.
Methodology Used
To obtain the initial group of schools to evaluate, the top schools were identified by using the percentage of students who scored “Proficient” on all five tests. This approach emphasizes the importance of getting all students to successfully pass the test. Those schools which had 91% of their 10th grade students pass all five portions of the test moved to the next round of the analysis. This year, 9.4% made the cut. Eight schools had 100% passing rates for all five portions of the test.
YEAR |
# ACHIEVING 91% THRESHOLD |
% ACHIEVING 91% THRESHOLD |
# OF SCHOOLS WITH 100% PASS RATE |
| 2007 | 59 |
6.0% |
7 |
| 2008 | 65 |
6.6% |
12 |
| 2009 | 114 |
11.3% |
13 |
| 2010 | 63 |
6.2% |
5 |
| 2011 | 84 |
8.2% |
8 |
| 2012 | 104 |
10.1% |
9 |
| 2013 | 96 |
9.5% |
8 |
After identifying the schools that met the 91% threshold, the next step was to calculate the "Performance Index Score (Adjusted)" (PIS) for each school. This field mimics the calculation that the Ohio Department of Education uses for its Performance Index Score, and it more accurately reflects the overall performance of a school. The difference between the ODE value and this document's is that this document calculates the number for only the 10th graders who took the tests. It also calculates the Performance Index Scores for private schools which the ODE does not provide. Creating this field permits an apples-to-apples comparison for all schools. Click here to go to the Appendix to view the calculation.
Championship Schools
My list of the championship schools are listed below in Performance Index Score order. St. Charles Preparatory, Seven Hills, and Ursuline Academy have been named as championship schools for each of the past seven years.
HIGH SCHOOL |
CITY |
COUNTY |
YEARS AS CHAMPION |
Columbus |
Franklin |
2007, 2008, 2010, 2011, 2012, 2013 |
|
Columbus |
Franklin |
2007, 2008, 2009, 2010, 2011, 2012, 2013 |
|
| Cincinnati | Hamilton | 2013 |
|
Cincinnati |
Hamilton |
2011, 2012, 2013 |
|
Cincinnati |
Hamilton |
2007, 2008, 2009, 2010, 2011, 2012, 2013 |
|
Cincinnati |
Hamilton |
2007, 2008, 2009, 2010, 2011, 2012, 2013 |
|
Cincinnati |
Hamilton |
2013 |
Identifying the Championship Schools
The criteria for selecting the championship schools should be relatively clear upon examination of the table below. The schools were selected based on a combination of Performance Index Scores, the number of top ten rankings in each subject, and a natural break between schools. The seven schools identified as champion schools had Performance Index Scores that were slightly higher than last year's championship schools.
This is the second year that statewide rankings are displayed for each school. To create the rankings, the Performance Index Scores were calculated for each individual subject. The schools' subject Performance Index Scores were then sorted. For example, Columbus School for Girls had the highest ranking with its overall Performance Index Score (116.4) , and when the same calculation was used to create a "Performance Index Score" for the individual subjects, it was also ranked first in Reading and Social Studies. The schools which have subjects ranked in the state's top ten are further identified with a blue background.
The subject rankings provide an additional dimension by helping to identify the strengths and weaknesses within each school. To view detailed performance on each school, click on the school name. Please note that the amount of information available for each school has been expanded this year to include five years of trend charts. (See below for more information about the rankings.)
Note that the table is long -- it contains detailed data for all of the 93 schools that reached the 91% threshold. These schools are sorted according to their Performance Index Scores.
| HIGH SCHOOL / DISTRICT |
# STU. |
PASS 5% |
STATEWIDE RANKINGS |
# TOP 10 |
||||||
READING |
MATH |
WRITING |
SCIENCE |
SOCIAL STUDIES |
||||||
| Columbus School for Girls OAIS - Columbus School For Girls |
Franklin | 45 |
116.4 |
100%
|
1
|
6
|
4
|
2
|
1
|
5 |
| St Charles Preparatory HS Columbus Diocese |
Franklin | 151 |
116.4 |
100%
|
4
|
1
|
5
|
1
|
2
|
5 |
| Madeira High School Madeira City |
Hamilton | 106 |
115.1 |
97.2%
|
3
|
3
|
40
|
3
|
4
|
4 |
| Walnut Hills High School Cincinnati City |
Hamilton | 375 |
114.6 |
97.9%
|
13
|
8
|
9
|
7
|
6
|
4 |
| Ursuline Academy HS Cincinnati Archdiocese |
Hamilton | 197 |
114.5 |
99.5%
|
2
|
7
|
3
|
9
|
43
|
4 |
| Seven Hills School OAIS - Seven Hills School |
Hamilton | 79 |
114.4 |
98.7%
|
5
|
15
|
23
|
5
|
22
|
2 |
| Indian Hill High School Indian Hill Exempted Village |
Hamilton | 147 |
114.3 |
93.9%
|
6
|
4
|
36
|
19
|
9
|
3 |
| Laurel School Academy OAIS - Laurel |
Cuyahoga | 64 |
114.2 |
100%
|
17
|
11
|
7
|
12
|
14
|
1 |
| Columbus Academy OAIS - Columbus Academy |
Franklin | 86 |
114.1 |
97.7%
|
18
|
16
|
54
|
4
|
15
|
1 |
| University School OAIS - University |
Cuyahoga | 92 |
114.0 |
100%
|
10
|
10
|
12
|
17
|
39
|
2 |
| Hathaway Brown HS OAIS - Hathaway Brown |
Cuyahoga | 89 |
113.9 |
98.9%
|
7
|
24
|
6
|
21
|
30
|
2 |
| Hawken School OAIS - Hawken School |
Geauga | 97 |
113.8 |
100%
|
12
|
31
|
17
|
10
|
24
|
1 |
| Summit Country Day HS OAIS - Summit Country Day |
Hamilton | 95 |
113.7 |
95.8%
|
46
|
40
|
1
|
18
|
8
|
2 |
| John Hay Early College High School Cleveland Municipal SD |
Cuyahoga | 52 |
113.7 |
96.2%
|
26
|
2
|
41
|
74
|
3
|
2 |
| HIGH SCHOOL / DISTRICT |
# STU. |
PASS 5% |
STATEWIDE RANKINGS |
# TOP 10 |
||||||
READING |
MATH |
WRITING |
SCIENCE |
SOCIAL STUDIES |
||||||
| Ottawa Hills High School Ottawa Hills Local |
Lucas | 79 |
113.6 |
94.9%
|
42
|
13
|
15
|
20
|
18
|
0 |
| Village Academy OAIS - Learning Unlimited-Village Academy |
Delaware | 19 |
113.4 |
100%
|
11
|
27
|
60
|
6
|
54
|
1 |
| Dublin Jerome High School Dublin City |
Franklin | 339 |
113.3 |
94.4%
|
29
|
37
|
27
|
22
|
13
|
0 |
| Our Lady of The Elms HS Cleveland Catholic Diocese |
Summit | 32 |
113.2 |
96.9%
|
9
|
20
|
89
|
7
|
65
|
2 |
| Solon High School Solon City |
Cuyahoga | 403 |
113.2 |
92.8%
|
19
|
56
|
29
|
16
|
34
|
0 |
| Cedarville High School Cedar Cliff Local |
Greene | 45 |
113.1 |
97.8%
|
59
|
29
|
1
|
15
|
55
|
1 |
| Aurora High School Aurora City |
Portage | 242 |
113.1 |
95.9%
|
39
|
22
|
66
|
24
|
11
|
0 |
| Oakwood High School Oakwood City |
Montgomery | 174 |
113.1 |
96.0%
|
68
|
17
|
10
|
29
|
27
|
1 |
| Miami Valley School OAIS - Miami Valley |
Montgomery | 41 |
113.1 |
100%
|
16
|
25
|
69
|
14
|
48
|
0 |
| Independence High School Independence Local |
Cuyahoga | 104 |
112.9 |
94.2%
|
52
|
30
|
87
|
26
|
7
|
1 |
| Upper Arlington High School Upper Arlington City |
Franklin | 409 |
112.8 |
95.1%
|
57
|
23
|
59
|
31
|
16
|
0 |
| Toledo Early College High School Toledo City |
Lucas | 52 |
112.8 |
94.2%
|
20
|
12
|
64
|
37
|
46
|
0 |
| Hudson High School Hudson City |
Summit | 403 |
112.8 |
96.0%
|
35
|
55
|
25
|
27
|
31
|
0 |
| Western Reserve Academy OAIS - Western Reserve Academy |
Summit | 94 |
112.7 |
94.7%
|
14
|
14
|
34
|
11
|
156
|
0 |
| Orange High School Orange City |
Cuyahoga | 147 |
112.7 |
93.2%
|
32
|
64
|
22
|
50
|
12
|
0 |
| HIGH SCHOOL / DISTRICT |
# STU. |
PASS 5% |
STATEWIDE RANKINGS |
# TOP 10 |
||||||
READING |
MATH |
WRITING |
SCIENCE |
SOCIAL STUDIES |
||||||
| St Xavier HS Cincinnati Archdiocese |
Hamilton | 399 |
112.7 |
97.0%
|
28
|
28
|
100
|
25
|
38
|
0 |
| Cincinnati Hills Christian Academy OAIS - Cincinnati Hills Christian Academy |
Hamilton | 109 |
112.6 |
94.5%
|
34
|
26
|
19
|
47
|
45
|
0 |
| Russia High School Russia Local |
Shelby | 47 |
112.5 |
91.5%
|
30
|
9
|
53
|
28
|
86
|
1 |
| William Mason High School Mason City |
Warren | 809 |
112.5 |
93.0%
|
58
|
21
|
113
|
49
|
10
|
1 |
| Rocky River High School Rocky River City |
Cuyahoga | 210 |
112.4 |
91.0%
|
64
|
19
|
37
|
30
|
71
|
0 |
| Chagrin Falls High School Chagrin Falls Exempted Village |
Cuyahoga | 151 |
112.3 |
96.7%
|
21
|
45
|
31
|
40
|
64
|
0 |
| Wyoming High School Wyoming City |
Hamilton | 152 |
112.3 |
90.8%
|
44
|
38
|
61
|
58
|
28
|
0 |
| Mariemont High School Mariemont City |
Hamilton | 106 |
112.3 |
94.3%
|
50
|
76
|
16
|
43
|
36
|
0 |
| Dayton Regional STEM School |
59 |
112.3 |
91.5%
|
38
|
71
|
57
|
13
|
68
|
0 |
|
| Bishop Watterson HS Columbus Diocese |
Franklin | 257 |
112.2 |
96.1%
|
43
|
53
|
68
|
56
|
20
|
0 |
| Kalida High School Kalida Local |
Putnam | 54 |
112.2 |
98.1%
|
107
|
33
|
55
|
32
|
29
|
0 |
| Maumee Valley Country Day HS OAIS - Maumee Valley Country Day |
Lucas | 46 |
112.2 |
97.8%
|
23
|
32
|
35
|
35
|
91
|
0 |
| Bellbrook High School Sugarcreek Local School District |
Greene | 202 |
112.2 |
94.6%
|
37
|
54
|
91
|
34
|
32
|
0 |
| Turpin High School Forest Hills Local |
Hamilton | 305 |
112.1 |
93.8%
|
78
|
66
|
43
|
36
|
33
|
0 |
| Avon Lake High School Avon Lake City |
Lorain | 282 |
112.1 |
95.0%
|
45
|
41
|
38
|
33
|
74
|
0 |
| HIGH SCHOOL / DISTRICT |
# STU. |
PASS 5% |
STATEWIDE RANKINGS |
# TOP 10 |
||||||
READING |
MATH |
WRITING |
SCIENCE |
SOCIAL STUDIES |
||||||
| Olentangy High School Olentangy Local |
Delaware | 332 |
112.1 |
92.5%
|
69
|
44
|
52
|
60
|
34
|
0 |
| Minster High School Minster Local |
Auglaize | 68 |
112.0 |
91.2%
|
103
|
5
|
131
|
68
|
17
|
1 |
| Granville High School Granville Exempted Village |
Licking | 199 |
111.9 |
95.5%
|
40
|
39
|
48
|
42
|
75
|
0 |
| Olentangy Liberty High School Olentangy Local |
Delaware | 415 |
111.8 |
94.0%
|
71
|
35
|
41
|
64
|
59
|
0 |
| Fuchs Mizrachi of Cleveland Fuchs Mizrachiof Cleveland |
Cuyahoga | 26 |
111.6 |
96.2%
|
15
|
126
|
119
|
38
|
50
|
0 |
| Sycamore High School Sycamore Community City |
Hamilton | 400 |
111.6 |
91.3%
|
47
|
51
|
159
|
46
|
41
|
0 |
| St Vincent St Mary HS Cleveland Catholic Diocese |
Summit | 157 |
111.5 |
94.9%
|
118
|
62
|
76
|
44
|
40
|
0 |
| Carroll HS Cincinnati Archdiocese |
Montgomery | 171 |
111.5 |
93.6%
|
53
|
75
|
51
|
45
|
84
|
0 |
| St Ursula Academy Cincinnati Archdiocese |
Hamilton | 157 |
111.4 |
94.9%
|
22
|
81
|
28
|
55
|
136
|
0 |
| Magnificat HS Cleveland Catholic Diocese |
Cuyahoga | 204 |
111.3 |
95.1%
|
24
|
102
|
24
|
61
|
124
|
0 |
| Notre Dame-Cathedral Latin HS Cleveland Catholic Diocese |
Geauga | 167 |
111.2 |
95.8%
|
31
|
139
|
39
|
41
|
104
|
0 |
| Akron Early College High School Akron City |
Summit | 82 |
111.2 |
93.9%
|
106
|
137
|
63
|
62
|
25
|
0 |
| St Ignatius HS Cleveland Catholic Diocese |
Cuyahoga | 346 |
111.2 |
93.9%
|
41
|
77
|
110
|
80
|
56
|
0 |
| Whitney Young School Cleveland Municipal SD |
Cuyahoga | 27 |
111.1 |
100%
|
25
|
33
|
161
|
132
|
60
|
0 |
| Highland High School Highland Local |
Medina | 272 |
111.1 |
91.9%
|
92
|
51
|
88
|
64
|
70
|
0 |
| HIGH SCHOOL / DISTRICT |
# STU. |
PASS 5% |
STATEWIDE RANKINGS |
# TOP 10 |
||||||
READING |
MATH |
WRITING |
SCIENCE |
SOCIAL STUDIES |
||||||
| Wellington School OAIS - Wellington School |
Franklin | 42 |
111.1 |
97.6%
|
49
|
47
|
85
|
71
|
106
|
0 |
| Miller City High School Miller City-New Cleveland Local |
Putnam | 36 |
111.0 |
91.7%
|
97
|
171
|
96
|
51
|
23
|
0 |
| Dublin Coffman High School Dublin City |
Franklin | 458 |
110.8 |
91.5%
|
77
|
93
|
126
|
58
|
63
|
0 |
| Gilmour Academy ACADEMY OAIS - Gilmour Academy |
Cuyahoga | 81 |
110.8 |
95.1%
|
86
|
58
|
44
|
115
|
94
|
0 |
| St Joseph Academy Cleveland Catholic Diocese |
Cuyahoga | 171 |
110.8 |
93.0%
|
63
|
170
|
30
|
97
|
57
|
0 |
| Notre Dame Academy Toledo Diocese |
Lucas | 165 |
110.8 |
96.4%
|
55
|
90
|
11
|
92
|
142
|
0 |
| Mount Notre Dame HS Cincinnati Archdiocese |
Hamilton | 190 |
110.7 |
93.2%
|
66
|
65
|
75
|
94
|
122
|
0 |
| Cuyahoga Hts High School Cuyahoga Heights Local |
Cuyahoga | 71 |
110.6 |
91.5%
|
56
|
36
|
103
|
179
|
80
|
0 |
| Cincinnati Country Day HS OAIS - Cincinnati Country Day |
Hamilton | 71 |
110.6 |
94.4%
|
67
|
92
|
66
|
52
|
169
|
0 |
| Lakeview High School Lakeview Local |
Trumbull | 138 |
110.5 |
92.8%
|
84
|
103
|
70
|
102
|
73
|
0 |
| Archbishop Alter HS Cincinnati Archdiocese |
Montgomery | 173 |
110.5 |
91.9%
|
101
|
98
|
83
|
101
|
61
|
0 |
| Canfield High School Canfield Local |
Mahoning | 236 |
110.5 |
91.9%
|
141
|
106
|
107
|
81
|
53
|
0 |
| Fairfield Christian Academy Fairfield Christian Academy El |
Fairfield | 42 |
110.3 |
92.9%
|
27
|
87
|
58
|
123
|
181
|
0 |
| Grandview Heights High School Grandview Heights City |
Franklin | 81 |
110.3 |
93.8%
|
172
|
72
|
92
|
57
|
110
|
0 |
| Cuyahoga Valley Christian Academy Cuyahoga Valley Christian Acad |
Summit | 145 |
110.3 |
91.7%
|
70
|
127
|
98
|
108
|
83
|
0 |
| HIGH SCHOOL / DISTRICT |
# STU. |
PASS 5% |
STATEWIDE RANKINGS |
# TOP 10 |
||||||
READING |
MATH |
WRITING |
SCIENCE |
SOCIAL STUDIES |
||||||
| John Hay School of Science & Medicine Cleveland Municipal SD |
Cuyahoga | 81 |
110.2 |
96.3%
|
113
|
60
|
79
|
159
|
77
|
0 |
| Avon High School Avon Local |
Lorain | 271 |
110.2 |
91.9%
|
82
|
112
|
125
|
114
|
66
|
0 |
| Walsh Jesuit HS Cleveland Catholic Diocese |
Summit | 239 |
110.2 |
94.1%
|
73
|
155
|
77
|
79
|
114
|
0 |
| Beaumont School Cleveland Catholic Diocese |
Cuyahoga | 80 |
109.9 |
91.3%
|
65
|
227
|
13
|
155
|
115
|
0 |
| Moeller HS Cincinnati Archdiocese |
Hamilton | 230 |
109.9 |
92.6%
|
102
|
122
|
112
|
126
|
76
|
0 |
| South Range High School South Range Local |
Mahoning | 113 |
109.8 |
94.7%
|
111
|
95
|
152
|
86
|
109
|
0 |
| Toledo Christian HS Toledo Christian |
Lucas | 49 |
109.8 |
98.0%
|
80
|
130
|
193
|
54
|
134
|
0 |
| Bloomfield High School Bloomfield-Mespo Local |
Trumbull | 20 |
109.7 |
95.0%
|
162
|
135
|
279
|
91
|
25
|
0 |
| Anthony Wayne High School Anthony Wayne Local |
Lucas | 298 |
109.7 |
90.9%
|
131
|
89
|
180
|
95
|
95
|
0 |
| Ottoville High School Ottoville Local |
Putnam | 30 |
109.6 |
93.3%
|
126
|
68
|
221
|
103
|
103
|
0 |
| New Albany High School New Albany-Plain Local |
Franklin | 312 |
109.6 |
92.0%
|
121
|
99
|
93
|
142
|
125
|
0 |
| Norwalk Catholic School Toledo Diocese |
Huron | 48 |
109.5 |
93.8%
|
114
|
235
|
62
|
134
|
98
|
0 |
| McNicholas HS Cincinnati Archdiocese |
Hamilton | 142 |
109.3 |
93.0%
|
88
|
162
|
50
|
175
|
167
|
0 |
| Mother of Mercy HS Cincinnati Archdiocese |
Hamilton | 107 |
109.3 |
90.7%
|
62
|
101
|
72
|
163
|
253
|
0 |
| Bishop Fenwick HS Cincinnati Archdiocese |
Warren | 132 |
109.0 |
91.7%
|
95
|
134
|
109
|
105
|
239
|
0 |
| HIGH SCHOOL / DISTRICT |
# STU. |
PASS 5% |
STATEWIDE RANKINGS |
# TOP 10 |
||||||
READING |
MATH |
WRITING |
SCIENCE |
SOCIAL STUDIES |
||||||
| Central Catholic HS Youngstown Diocese |
Stark | 96 |
108.5 |
90.6%
|
154
|
131
|
114
|
93
|
306
|
0 |
| Lima Central Catholic HS Toledo Diocese |
Allen | 87 |
108.4 |
93.1%
|
204
|
257
|
74
|
149
|
139
|
0 |
| Delaware Christian HS Delaware Christian |
Delaware | 18 |
108.3 |
94.4%
|
97
|
274
|
46
|
137
|
300
|
0 |
| New London High School New London Local |
Huron | 77 |
107.7 |
94.8%
|
248
|
167
|
201
|
96
|
275
|
0 |
| Temple Christian School Temple Christian School |
Allen | 16 |
107.6 |
93.8%
|
176
|
440
|
245
|
225
|
37
|
0 |
| Hiland High School East Holmes Local |
Holmes | 68 |
106.7 |
91.2%
|
325
|
113
|
270
|
313
|
176
|
0 |
Using This List
The schools on My Top Academic Ohio High School list are all exceptional schools, however, there are other excellent schools which are not on the list because they did not reach the 91% "Passed Five of Five" threshold. If a school wants to proclaim that it is 25th on the list, that is appropriate. To proclaim that a school is 25th in academics in Ohio, is inappropriate. Again, the 91% threshold is extremely important because it tells readers that essentially all of the students are extremely serious about academics and that all of the kids in each and every classroom really care. There are also a few schools that have been on the list in the past (i.e. Columbus Torah Academy) but not this year because they did not have performance data. The ODE requires that at least ten students take the tests before they release the data and some schools did not have enough students take the test. For the complete ranking list of all schools in Ohio, click here.
Comparative Analysis
While the performance numbers and trend charts are beneficial, what sets this web site apart from others is the comparative analysis that this site permits with other schools and within schools.
An example of a side-by-side comparison is here with Lakota East and Lakota West. As with most schools within the same school system, the results are similar.
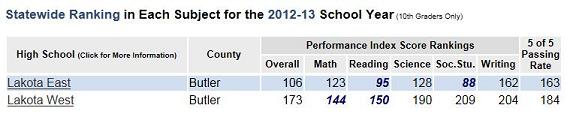 Looking at a comparison within a school, Lakota East excels in Reading and Social Studies. Lakota West is stronger in Mathematics and Reading. Lakota East is also substantially better in Reading and Social Studies than Lakota West.
One of the goals for this web site is to encourage communities to become better informed and to ask questions. I believe these tools encourage this.
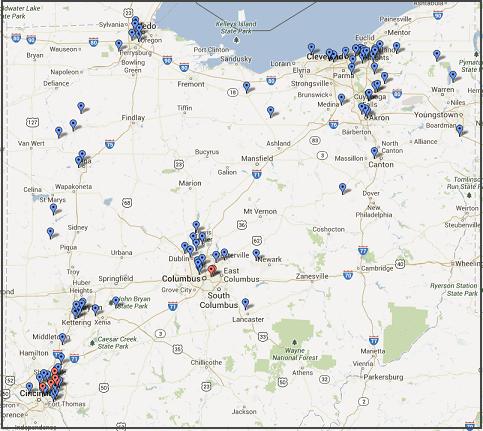
Map of Top Schools
It is easier to visualize the schools and Ohio's areas of education strength by providing a map. Click on the link to view the map or click on the image to the right.
 Readers may use the map scroll bar on the left to navigate the map.
Note that the Gerber Analytics' championship schools use red markers, and the others use blue.
Hover over the marker to see the school name. Click on the marker to see the school's Performance Index Score.
The satellite view is also available via the controls on the upper right.
To Repeat a Portion of Last Year's Report. . .
Does this document include any mistakes? Hopefully not, the data was carefully entered and the numbers were double checked, but it is possible. Please send a Feedback message with any significant discrepancies. The revised document will be updated and placed online.
Will this type of ranking put more pressure on schools to do well? It might if the State of Ohio would endorse and publish the results of this type of friendly competition. It would encourage all schools and their students to do better as they strive to be one of the best schools. However, this is not about applying pressure to just the high schools. Excellent performance on this 10th grade test is not possible without the following:
- Hard-working students who are willing to spend multiple hours on homework every night and who are challenging and competing against their fellow classmates. (And remember, unlike sporting events, every student in the 10th grade participates and every student matters.)
- Caring parents who are giving their children an opportunity to work on their assignments and making the sacrifices to help their children by transporting them to better schools outside of their neighborhood; by paying tuition or higher property taxes (or both) to allow their children to go to a better school; and/or by moving to a community that places a greater emphasis on education
- Outstanding teachers who teach well and who can motivate their students
- Administrations who set high expectations for the students, teachers, and parents
- Outstanding elementary and middle school teachers who have established a solid foundation for the students
- Active volunteers who help with those activities that the teacher / administrative staff do not have the expertise and/or time to perform
- Supporting communities that place a high value on education and by ensuring that there is a tradition of academic excellence
Will this type of ranking force schools to spend more time emphasizing the process of test taking? Some schools spend an inordinate amount of time teaching their students to take the OGT. The above schools also prepare for the OGT, but they likely cover the fundamentals so thoroughly that the OGT is a minor distraction for them -- not a major emphasis. There are also some schools that appear to have substantially better approaches than others to teach some subjects. Perhaps they would be willing to share some of their best practices with other schools?
While it would certainly be great to profit from this effort, please record the last seven years of this education analysis as a pro-bono or volunteer effort. I do this type of analysis because I enjoy doing it. I am also hopeful that it will benefit an extremely large number of Ohioans. If this analysis receives a large distribution, that might happen. I certainly appreciate the Cincinnati Enquirer's coverage of this analysis in previous years.
You may forward this report to anyone you wish but please give proper attribution if you use any of this material. To assist with tracking, please provide others with this link:
I have a substantial "one-of-a-kind" database, and I am open to new analysis projects. If you have an education-related analysis project in mind that you think would benefit all Ohio schools, please contact me.
Please let me know if you have any questions or comments.
Scott Gerber
Gerber Analytics, LLC
GerberAnalytics.com
Click to submit a Feedback for any questions and/or to have your email address included so that you may be alerted to additional analysis.
** Note: Chagrin Fall's "Pass All Five %" was listed at 96.7% in ODE electronic media that is used to acquire that number. Based on other numbers provided by the ODE, the 96.7% cannot be correct, and it was not included on this list.
*** Revised Note: On 11/20/2014 Chagrin Falls' Principal Steven Ast made me aware that the ODE numbers were incorrect for their school in 2013. The correct numbers were included on 11/21/14 and Chagrin Falls was included in the Top Schools report and the rankings were re-computed.
Calculation of Performance Index Score (Adjusted)
Note that the Performance Index Score (Adjusted) is different from what you may have seen on the Ohio Department of Education’s Report Card. The calculation in this document is only for the 10th grade students. It was calculated as follows:
Ada High School
Subject |
Below Basic | Basic | Proficient | Accelerated | Advanced |
|
| Mathematics | 9.4% | 9.4% | 24.5% | 20.8% | 35.8% | |
| Reading | 3.8% | 5.7% | 43.4% | 35.8% | 11.3% | |
| Science | 3.8% | 18.9% | 26.4% | 22.6% | 28.3% | |
| Social Studies | 15.1% | 9.4% | 24.5% | 22.6% | 28.3% | |
| Writing | 5.7% | 5.7% | 39.6% | 47.2% | 1.9% | |
| Total of Above | 37.7% | 49.1% | 158.5% | 149.1% | 105.7% | |
| Average of 5 | 7.5% | 9.8% | 31.7% | 29.8% | 21.1% | |
| Factor | 0.3 | 0.6 | 1 | 1.1 | 1.2 | |
| Summation | ||||||
| Average * Factor | 2.3 | 5.9 | 31.7 | 32.8 | 25.4 | 98 |
The new "Advanced Plus" designation was used randomly for some schools. To insure an "apples-to-apples" comparison, the percentage of students scoring "Advanced Plus" was added to the Advance category.
Amendments:
November 20, 2013: Two schools were added to this list: Canfield and Avon. Their "Passed Five of Five" percentages were initially omitted, which prevented them from being added to this list. The detailed reports for each school were also amended.
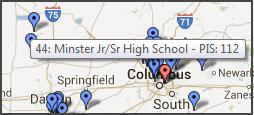 November 20, 2013: The Map of Top Schools was modified to include the two schools above and to include each school's Performance Index Score when users hover over the marker.
November 21, 2014: Chagrin Falls' Principal Steven Ast made me aware that the ODE website contained incorrect scores for the 2013 school year. New scores were retrieved and used in this modified report.