

THE TOP ACADEMIC
OHIO HIGH SCHOOLS - 2019
AUGUST 12, 2020 (v1)
PREPARED BY SCOTT GERBER
GERBER ANALYTICS, LLC | OHIOTENNISZONE.COM
Many education enthusiasts may remember the Gerber Analytics' 2007-2014 high school academic reports that were generated from the Ohio Graduation Test (OGT) results. Unfortunately, the OGT was discontinued. Now that the OGT has been replaced with the ACT and SAT tests, it is once again time to offer this report and the detailed school reports.
This information is already interesting to many, but it will be especially worthwhile as post-COVID-19 results arrive. It will also be very fascinating to compare schools that offered in-person classes versus those that only offered remote classes.
What Was Included?
Unlike the Ohio Graduation Tests, which all schools were required to take, schools now choose between the ACT or SAT.
There were 825 schools included in this analysis. The number of schools that took the ACT totaled 725 (88%), while 100 (12%) schools took the SAT. The Ohio Department of Education (ODE) provided the data.
While the OGT tests measured school performance using five subject tests -- Reading, Mathematics, Writing, Science, and Social Studies. The ACT measures Reading, Mathematics, English, and Science. The SAT only measures Mathematics and Evidenced-Based Reading and Writing, which comprises the Reading and English components.
Methodology Used
All schools were ranked based on their performance. This was straight-forward for the four ACT subject matter tests. It was not as clear cut for the schools which took the SAT tests.
For the rankings, the SAT results were converted to ACT values by using the Guide to the 2018 ACT/SAT Concordance which is published by the CollegeBoard. There were three steps. The SAT Composite was converted to the ACT Composite; the SAT Math was converted to the ACT Math; and the SAT Evidenced-Based Reading and Writing was equally split between the ACT Reading and ACT English values.
As an example, Indian Hill scored a 1221.74 on the SAT Composite. That converted to an ACT Composite score of 25.33. Their SAT Math score of 612.25 converted to an ACT 26, and the Indian Hill Evidenced Based Reading and Writing (EBR) score converted from 609.49 to 52. The 52 EBR was equally split between ACT Reading (26) and English. Is this a perfect way to split the value? Maybe not, but it still provides readers with a reasonable estimate of a school's performance. As a result of this, Indian Hill was ranked ninth in the ACT Composite and tenth, fifth, and seventh in the Reading, Math, and English subjects, respectively. They had no ranking for Science.
The absence of an SAT Science score caused another problem. It made the rankings for the ACT Science scores higher than they should be since 100 SAT Science scores did not exist. For schools with the lowest ACT Science scores, their ACT Science rankings were 100 places better than they should be. To remedy this and for ranking purposes only, SAT Composite scores were used as placeholder SAT Science scores. These rankings will not be shown for SAT schools. Note that only five of the 50 schools on the list took the SAT test so this has limited impact for this report.
Championship Schools
While there was Ohio Graduation Test data available for all of Ohio's schools, that is not the case for this analysis. This report does include many of Ohio's best schools, but not all. There was no data provided for several schools that had previously been Gerber Analytics' Championship Schools. Those omitted include: Hathaway Brown, Seven Hills, Columbus School for Girls, and Columbus Academy.
While the list below is worthwhile, it is not complete. It is probably fine for schools to declare that they were listed 15th on this Gerber Analytics report, but not 15th in the state of Ohio in education.
For the above reason, Gerber Analytics will not be using the Championship School designation as has been done in previous years.
Reading the Table
The table should be self-explanatory. It is sorted by the ACT or the SAT conversion score. It includes the number of students, the ACT | SAT score, the OhioTennisZone.com link (see below), the school's rankings in Reading, Math, English, and Science, and the number of Top 10 rankings which the school received. The SAT score is in italics and it is a much larger number. Subjects in which a school received a Top 10 score is highlighted in a darker shade of blue.
The subject rankings provide an additional dimension by helping to identify the strengths and weaknesses within each school. To view detailed performance on each school, click on the school name.
| HIGH SCHOOL / DISTRICT |
# STU. |
HS TENNIS |
STATEWIDE RANKINGS |
# TOP 10 |
|||||
READING |
MATH |
ENGLISH |
SCIENCE |
||||||
| Ursuline Academy Cincinnati Archdiocese |
Hamilton | 163 |
27.85 |
1
|
3
|
1
|
3
|
4 |
|
| St Charles Preparatory Columbus Diocese |
Franklin | 151 |
27.44 |
|
3
|
1
|
2
|
1
|
4 |
| St Xavier Cincinnati Archdiocese |
Hamilton | 351 |
27.08 |
4
|
4
|
3
|
2
|
4 |
|
| Ottawa Hills Ottawa Hills Local |
Lucas | 62 |
26.79 |
7
|
2
|
5
|
4
|
4 |
|
| Wyoming Wyoming City |
Hamilton | 164 |
26.60 |
2
|
8
|
6
|
6
|
4 |
|
| St Ursula Academy Cincinnati Archdiocese |
Hamilton | 159 |
26.28 |
|
5
|
18
|
4
|
7
|
3 |
| Walnut Hills Cincinnati City |
Hamilton | 488 |
25.84 |
6
|
12
|
9
|
8
|
3 |
|
| Oakwood Oakwood City |
Montgomery | 173 |
25.64 |
|
13
|
7
|
16
|
5
|
2 |
| Indian Hill Indian Hill Exempted Village |
Hamilton | 138 |
1221.74 |
10
|
5
|
7
|
3 |
||
| Maumee Valley Country Day OAIS - Maumee Valley Country Day |
Lucas | 61 |
25.02 |
9
|
14
|
10
|
34
|
2 |
|
| Grandview Heights Grandview Heights City |
Franklin | 81 |
25.02 |
14
|
19
|
13
|
11
|
0 |
|
| St Ignatius Cleveland Catholic Diocese |
Cuyahoga | 331 |
1209.82 |
10
|
10
|
7
|
3 |
||
| Madeira Madeira City |
Hamilton | 96 |
24.93 |
15
|
13
|
14
|
17
|
0 |
|
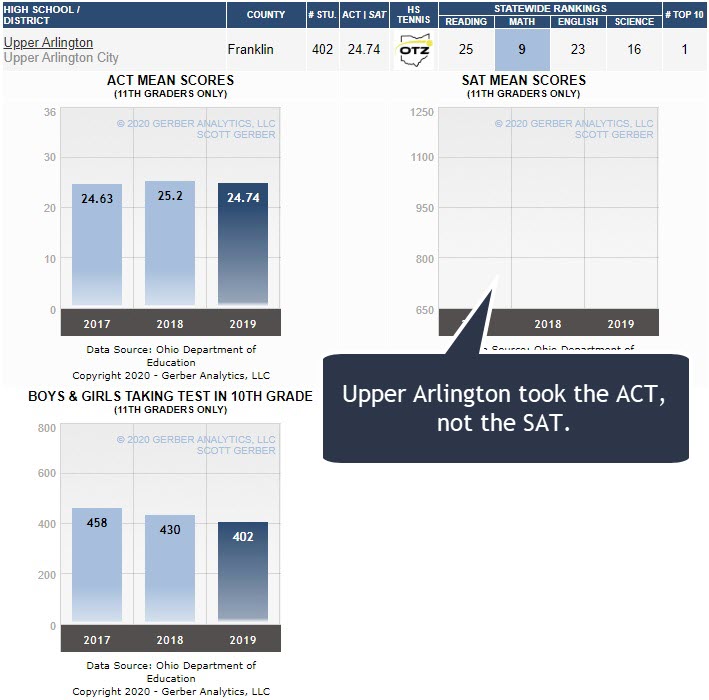
| Upper Arlington Upper Arlington City |
Franklin | 402 |
24.74 |
|
25
|
9
|
23
|
16
|
1 |
| HIGH SCHOOL / DISTRICT |
# STU. |
ACT | SAT |
HS TENNIS |
STATEWIDE RANKINGS |
# TOP 10 |
||||
READING |
MATH |
ENGLISH |
SCIENCE |
||||||
| Dublin Jerome Dublin City |
Franklin | 443 |
1200.27 |
|
19
|
5
|
11
|
1 |
|
| Fenwick Cincinnati Archdiocese |
Warren | 122 |
24.48 |
8
|
51
|
18
|
20
|
1 |
|
| Notre Dame-Cathedral Latin Cleveland Catholic Diocese |
Geauga | 181 |
24.35 |
22
|
24
|
19
|
28
|
0 |
|
| Chagrin Falls Chagrin Falls Exempted Village |
Cuyahoga | 174 |
1188.97 |
19
|
10
|
11
|
1 |
||
| Mason Mason City |
Warren | 821 |
24.25 |
|
27
|
20
|
33
|
14
|
0 |
| Hudson Hudson City |
Summit | 345 |
24.21 |
18
|
28
|
36
|
19
|
0 |
|
| Solon Solon City |
Cuyahoga | 392 |
24.20 |
|
29
|
15
|
32
|
22
|
0 |
| Walsh Jesuit Cleveland Catholic Diocese |
Summit | 257 |
24.18 |
17
|
57
|
17
|
23
|
0 |
|
| McNicholas Cincinnati Archdiocese |
Hamilton | 122 |
24.17 |
28
|
54
|
14
|
20
|
0 |
|
| Revere Revere Local |
Summit | 168 |
24.17 |
|
38
|
22
|
27
|
18
|
0 |
| Olentangy Liberty Olentangy Local |
Delaware | 513 |
24.16 |
|
40
|
15
|
34
|
13
|
0 |
| Granville Granville Exempted Village |
Licking | 221 |
24.12 |
16
|
20
|
48
|
31
|
0 |
|
| Archbishop Alter Cincinnati Archdiocese |
Montgomery | 162 |
24.00 |
|
24
|
47
|
20
|
25
|
0 |
| Sycamore Sycamore Community City |
Hamilton | 342 |
23.99 |
31
|
26
|
30
|
26
|
0 |
|
| Mariemont Mariemont City |
Hamilton | 116 |
23.83 |
21
|
49
|
28
|
32
|
0 |
|
| HIGH SCHOOL / DISTRICT |
# STU. |
ACT | SAT |
HS TENNIS |
STATEWIDE RANKINGS |
# TOP 10 |
||||
READING |
MATH |
ENGLISH |
SCIENCE |
||||||
| Bexley Bexley City |
Franklin | 174 |
23.81 |
22
|
34
|
45
|
26
|
0 |
|
| Mount Notre Dame Cincinnati Archdiocese |
Hamilton | 159 |
23.70 |
12
|
83
|
22
|
50
|
0 |
|
| Turpin Forest Hills Local |
Hamilton | 225 |
23.66 |
32
|
29
|
50
|
28
|
0 |
|
| Olentangy Berlin Olentangy Local SD |
Delaware | 255 |
23.59 |
50
|
23
|
57
|
24
|
0 |
|
| Bishop Watterson Columbus Diocese |
Franklin | 163 |
23.59 |
30
|
60
|
26
|
36
|
0 |
|
| Olentangy Olentangy Local |
Delaware | 236 |
23.41 |
|
55
|
25
|
64
|
33
|
0 |
| New Albany New Albany-Plain Local |
Franklin | 375 |
23.33 |
43
|
40
|
43
|
38
|
0 |
|
| Tree Of Life-Northridge Branch Tree of Life |
Franklin | 36 |
23.31 |
35
|
63
|
31
|
49
|
0 |
|
| Bay Bay Village City |
Cuyahoga | 211 |
23.27 |
54
|
38
|
55
|
30
|
0 |
|
| Cuyahoga Valley Christian Academy Cuyahoga Valley Christian Acad |
Summit | 145 |
1150.28 |
35
|
30
|
21
|
0 |
||
| Avon Avon Local |
Lorain | 331 |
23.16 |
57
|
57
|
34
|
40
|
0 |
|
| St John's Jesuit Toledo Diocese |
Lucas | 136 |
23.12 |
34
|
41
|
79
|
37
|
0 |
|
| Beachwood Beachwood City |
Cuyahoga | 127 |
23.11 |
46
|
37
|
55
|
46
|
0 |
|
| St Joseph Academy Cleveland Catholic Diocese |
Cuyahoga | 180 |
23.08 |
|
26
|
100
|
25
|
81
|
0 |
| Aurora Aurora City |
Portage | 221 |
22.99 |
39
|
55
|
69
|
44
|
0 |
|
| HIGH SCHOOL / DISTRICT |
# STU. |
ACT | SAT |
HS TENNIS |
STATEWIDE RANKINGS |
# TOP 10 |
||||
READING |
MATH |
ENGLISH |
SCIENCE |
||||||
| Independence Independence Local |
Cuyahoga | 83 |
22.93 |
41
|
74
|
45
|
58
|
0 |
|
| Springboro Springboro Community City |
Warren | 502 |
22.91 |
|
64
|
39
|
66
|
42
|
0 |
| Olentangy Orange Olentangy Local SD |
Delaware | 488 |
22.84 |
66
|
35
|
84
|
41
|
0 |
|
| Archbishop Hoban Cleveland Catholic Diocese |
Summit | 198 |
22.80 |
47
|
103
|
24
|
82
|
0 |
|
| Worthington Christian Worthington Christian |
Franklin | 81 |
22.79 |
35
|
127
|
45
|
52
|
0 |
|
| Loveland Loveland City |
Hamilton | 367 |
22.78 |
47
|
67
|
73
|
60
|
0 |
|
Additional Graphs Provide a New Perspective
Viewing trend charts is the best way to evaluate schools because it makes it possible to see which schools are already outstanding and which schools are trending higher. Three year trend charts are provided within this document for the ACT Mean Scores (or SAT Mean Scores) and the Number of Students Who Took the Test. As more years of data are acquired, they will be listed in future reports. By adding these graphs, this likely makes this report the most valuable and succinct document to compare Ohio's best schools. Note that some schools do not include three years of data because they switched from the ACT to the SAT or vice versa during this three year period.
 |
Upper Arlington - Click for Graph View |
Click on the following link to view the graphs for all of these schools. Click on the next link to return to normal viewing.
Note that these graphs only reflect those students who took the test as 11th graders.
OhioTennisZone.com
Many schools and parents know "Gerber Analytics" as the provider of the best web site to obtain detailed Ohio high school tennis information. As a bonus to the top schools that support OhioTennisZone.com, a link to that school's tennis report is available via the OTZ link.
Tennis players typically do very well academically so it is worthwhile for middle school parents and students to be aware of the schools that offer both great academics and great tennis programs.
Note that Safari browser users (typically used in Apple products) may experience a "421 Misdirected Request" problem when clicking on the "OTZ" link. It is best to use a different browser or go to OhioTennisZone.com directly to view this information.
Summary
Does this document include any mistakes? Hopefully not. The data was carefully entered and the numbers were double checked, but it is possible. Please send a Feedback message with any significant discrepancies. The revised document will be updated and placed online.
Will this type of ranking put more pressure on schools to do well? It might if the State of Ohio would endorse and publish the results of this type of friendly competition. It would encourage all schools and their students to do better as they strive to be one of the best schools. However, this is not about applying pressure to just the high schools. Excellent performance on this 11th grade test is not possible without the following:
- Hard-working students who are willing to spend multiple hours on homework every night and who are challenging and competing against their fellow classmates. (And remember, unlike during sporting events, every student in the 11th grade participates in this test and every student matters.)
- Caring parents who are giving their children an opportunity to work on their assignments and making the sacrifices to help their children by transporting them to better schools outside of their neighborhood; by paying tuition or higher property taxes (or both) to allow their children to go to a better school; and/or by moving to a community that places a greater emphasis on education
- Outstanding teachers who teach well and who can motivate their students
- Administrations who set high expectations for the students, teachers, and parents
- Outstanding elementary and middle school teachers who have established a solid foundation for the students
- Active volunteers who help with those activities that the teacher / administrative staff do not have the expertise and/or time to perform
- Supporting communities that place a high value on education and by ensuring that there is a tradition of academic excellence
While it would certainly be great to profit from this effort, please record the last decade of Gerber Analytics reports as a pro-bono or volunteer effort. I do this type of analysis because I enjoy doing it. I am also hopeful that it will benefit an extremely large number of Ohioans. If this analysis receives a large distribution, that might happen.
You may forward this report to anyone you wish but please give proper attribution if you use any of this material. To assist with tracking, please provide others with the link to the report..
Please let me know if you have any questions or comments.
Scott Gerber
Gerber Analytics, LLC
GerberAnalytics.com and OhioTennisZone.com
Click to submit a Feedback for any questions and/or to have your email address included so that you may be alerted to additional analysis work.