

OHIO HIGH SCHOOL ACADEMIC COMPARISONS
FOR CINCINNATI, CLEVELAND,
COLUMBUS, TOLEDO SCHOOL DISTRICTS
JANUARY 26, 2015
PREPARED BY SCOTT GERBER
GERBER ANALYTICS, LLC
The table below highlights the academic performance of the high schools in the Cincinnati, Cleveland, Columbus, and Toledo metro school districts based on each school's 10th grader performance on the Ohio Graduation Test (OGT). Included with the table are links that provide even greater insight and detail.
The table below includes: the Gerber Analytics state ranking for all public and private schools in Ohio; the number of 10th grade students who took the test; the overall Performance Index Score; the percentage of students who passed all five portions of the OGT; and the state rankings of each school for each subject test. The state rankings are based on the Performance Index Scores for all schools.
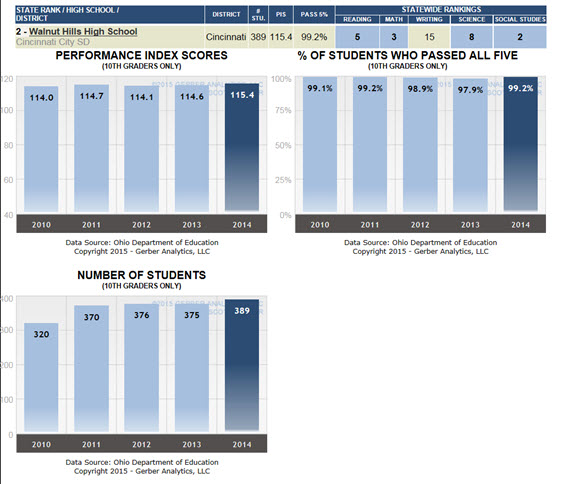
To highlight three of the schools, Cincinnati's Walnut Hills was ranked second overall in the state (out of almost thousand high schools). That is an enormous accomplishment when considering that Walnut Hills has a very large tenth grade class (389 students). Toledo Early College had two state top ten finishes in Math and Social Studies. John Hay Early College was ranked second in Mathematics.
Refer to last year's report for a better understanding of how this report is compiled.
Read on below to see how to view performance graphs for each school and to view all of the districts' schools separately.
| STATE RANK / HIGH SCHOOL / DISTRICT |
DISTRICT |
# STU. |
PIS |
PASS 5% |
STATEWIDE RANKINGS |
||||
READING |
MATH |
WRITING |
SCIENCE |
SOCIAL STUDIES |
|||||
|
2 - Walnut Hills High School Cincinnati City SD |
Cincinnati | 389 |
115.4 |
99.2%
|
5
|
3
|
15
|
8
|
2
|
|
133 - School For Creat & Perf Arts High School Cincinnati City SD |
Cincinnati | 115 |
108.3 |
84.3%
|
76
|
172
|
48
|
325
|
137
|
|
269 - Clark Montessori High School Cincinnati City SD |
Cincinnati | 94 |
105.5 |
83.0%
|
165
|
470
|
289
|
250
|
235
|
|
758 - Dater High School Cincinnati City SD |
Cincinnati | 116 |
93.5 |
60.3%
|
825
|
772
|
683
|
780
|
650
|
|
785 - Shroder Paideia High School Cincinnati City SD |
Cincinnati | 104 |
91.1 |
51.0%
|
785
|
806
|
630
|
827
|
789
|
|
804 - West Side Montessori High School Cincinnati City SD |
Cincinnati | 40 |
90.5 |
55.0%
|
831
|
803
|
715
|
825
|
785
|
|
815 - Oyler Elementary School Cincinnati City SD |
Cincinnati | 41 |
89.5 |
41.5%
|
816
|
778
|
843
|
840
|
788
|
|
844 - Withrow University High School Cincinnati City SD |
Cincinnati | 209 |
86.6 |
37.3%
|
855
|
825
|
821
|
867
|
843
|
|
870 - Woodward Career Technical High School Cincinnati City SD |
Cincinnati | 98 |
83.6 |
28.6%
|
873
|
851
|
876
|
901
|
864
|
|
871 - Hughes STEM High School Cincinnati City SD |
Cincinnati | 126 |
83.5 |
30.2%
|
910
|
856
|
907
|
887
|
828
|
|
873 - Riverview East Academy Cincinnati City SD |
Cincinnati | 33 |
83.2 |
39.4%
|
890
|
870
|
835
|
877
|
881
|
|
880 - Western Hills University High School Cincinnati City SD |
Cincinnati | 167 |
82.7 |
32.3%
|
892
|
867
|
873
|
916
|
856
|
|
918 - Aiken College and Career High School Cincinnati City SD |
Cincinnati | 57 |
77.3 |
14.0%
|
893
|
860
|
932
|
956
|
942
|
|
951 - Robert A. Taft Information Technology H Cincinnati City SD |
Cincinnati | 102 |
72.5 |
25.5%
|
951
|
929
|
940
|
954
|
965
|
| HIGH SCHOOL / DISTRICT |
DISTRICT |
# STU. |
PIS |
PASS 5% |
STATEWIDE RANKINGS |
||||
READING |
MATH |
WRITING |
SCIENCE |
SOCIAL STUDIES |
|||||
|
955 - Virtual High School Cincinnati City SD |
Cincinnati | 30 |
71.9 |
30.0%
|
960
|
926
|
962
|
945
|
953
|
Trend Charts for Performance Index Scores, % Who Passed all Five Tests, and Number of 10th Grade Students Who Took The Test
While the table above provides a good, static comparison among metro schools, it does not provide readers with a "over time" perspective. Click on this link to see five year trend charts for each school's Performance Index Score and % Who Passed All Five Tests.
 Click on this link to return to the table view.
The main questions generated from the graphs include:
How does Walnut Hills keep adding more students and keep getting better?
John Hay Early College is an excellent school. Can it be expanded to include more students?
What is happening to Columbus' Whetstone and Northland enrollment numbers over the last few years? Why are kids leaving?
Cincinnati's Withrow University enrollment numbers have grown as its academic performance declines. Why are students attending this school in greater numbers?
Columbus' East High School and South High School were completely renovated and reopened in 2008 and 2010, respectively. Why hasn't this led to better performance and higher enrollment?
What happened with Cincinnati's Robert Taft Information Technology high school? Did they pick up approximately 40 low performing students from another school?
School District-Only View
It is worthwhile to view each school district by itself. Click to view:
Click to view all school districts.
Comparative Analysis
While the performance numbers and trend charts are beneficial, what sets this web site apart from others is the comparative analysis that this site permits with other schools and within schools.
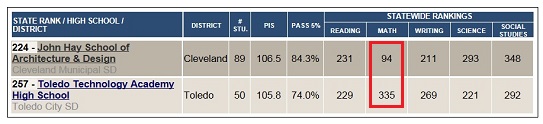 As expected, students who are enrolled in John Hay School of Architecture & Design do especially well in Math.
Given Toledo Technology Academy's name, Science would likely be their forte and it is. It is surprising that Math is their weakest subject.
One of the goals for this web site is to encourage communities to become better informed and to ask questions. These tools encourage it.
Comparing the Cincinnati, Cleveland, Columbus, and Toledo School Districts
Cincinnati leads the way - again. Cincinnati's Walnut Hills is the crown jewel of the metro school systems. It provides those who really care about academics with an excellent choice for a traditional high school environment that includes athletics and all of the other extra-curricular activities. Of course, it is more than simply a choice. Students (and their parents) have to choose to earn the right to attend the school. This means making the very difficult choices to work hard and to make sacrifices throughout the pre-K, elementary, and middle school years.
Also note how many students Walnut Hills benefits. While it is great that Cleveland and Toledo offer small, boutique schools for high achievers, the three Cleveland John Hay schools and the two Toledo schools at the top of this table benefit less students (totaling 339) than one Walnut Hills (with 389 students in 10th grade).
Here are several statements to consider. Great schools can only be great if the students (and their parent(s)) really care about learning. There has to be a critical mass of students who care to make this happen. A critical mass does not contain everyone -- it must contain the group who cares. The group of people who do care can be identified based on their previous hard work and great results. Walnut Hills does this. It is not possible to "focus" on an entire school district to make it great. If it happens at all, it would take decades and many generations of families to do this. No one has that much time. Likewise, districts need vocational school alternatives for those families who are unwilling to make sacrifices for education.
Corrections
Does this document include any mistakes? Hopefully not, the data was carefully entered and the numbers were double checked, but it is possible. Please send a Feedback message with any significant discrepancies. The revised document will be updated and placed online.
This analysis uses the results as originally reported by the Columbus City Schools.
You may forward this report to anyone you wish but please give proper attribution if you use any of this material. To assist with tracking, please provide others with this link:
http://gerberanalytics.com/ogt/ogt_major_metro_2014.php
I have a substantial "one-of-a-kind" database, and I am open to new analysis projects. If you have an education-related analysis project in mind that you think would benefit all Ohio schools, please contact me.
Please let me know if you have any questions or comments.
Scott Gerber
Gerber Analytics, LLC
GerberAnalytics.com
Click to submit a Feedback for any questions and/or to have your email address included so that you may be alerted to additional analysis.
Calculation of Performance Index Score (Adjusted)
Note that the Performance Index Score (Adjusted) is different from what you may have seen on the Ohio Department of Education’s Report Card. The calculation in this document is only for the 10th grade students. It was calculated as follows:
Ada High School
Subject |
Below Basic | Basic | Proficient | Accelerated | Advanced |
|
| Mathematics | 9.4% | 9.4% | 24.5% | 20.8% | 35.8% | |
| Reading | 3.8% | 5.7% | 43.4% | 35.8% | 11.3% | |
| Science | 3.8% | 18.9% | 26.4% | 22.6% | 28.3% | |
| Social Studies | 15.1% | 9.4% | 24.5% | 22.6% | 28.3% | |
| Writing | 5.7% | 5.7% | 39.6% | 47.2% | 1.9% | |
| Total of Above | 37.7% | 49.1% | 158.5% | 149.1% | 105.7% | |
| Average of 5 | 7.5% | 9.8% | 31.7% | 29.8% | 21.1% | |
| Factor | 0.3 | 0.6 | 1 | 1.1 | 1.2 | |
| Summation | ||||||
| Average * Factor | 2.3 | 5.9 | 31.7 | 32.8 | 25.4 | 98 |
The new "Advanced Plus" designation was used randomly for some schools. To insure an "apples-to-apples" comparison, the percentage of students scoring "Advanced Plus" was added to the Advance category.